IoT solutions and automatic control systems have, until now, mostly been designed from the point of view of the supplier or the developer. With sensors and control gear at the centre of things, the managers who actually use them often struggle to adapt to an unfamiliar interface. Over time, the features you rarely touch are forgotten; and when the team grows or a handover is needed, the same inconvenience repeats — digging through emails and stacks of paper to find what was recorded.
The biggest problem with managing a space through documents and drawings alone is that the information is fragmented. Just piecing together where this is and what information connects to which device eats enormous amounts of time. When methods differ from person to person as well, the waste of time and effort grows in proportion to the resources you put in.
There is one key that improves all of this: integrating space, information and control into a digital twin.
1. A system where drawing the map is the management
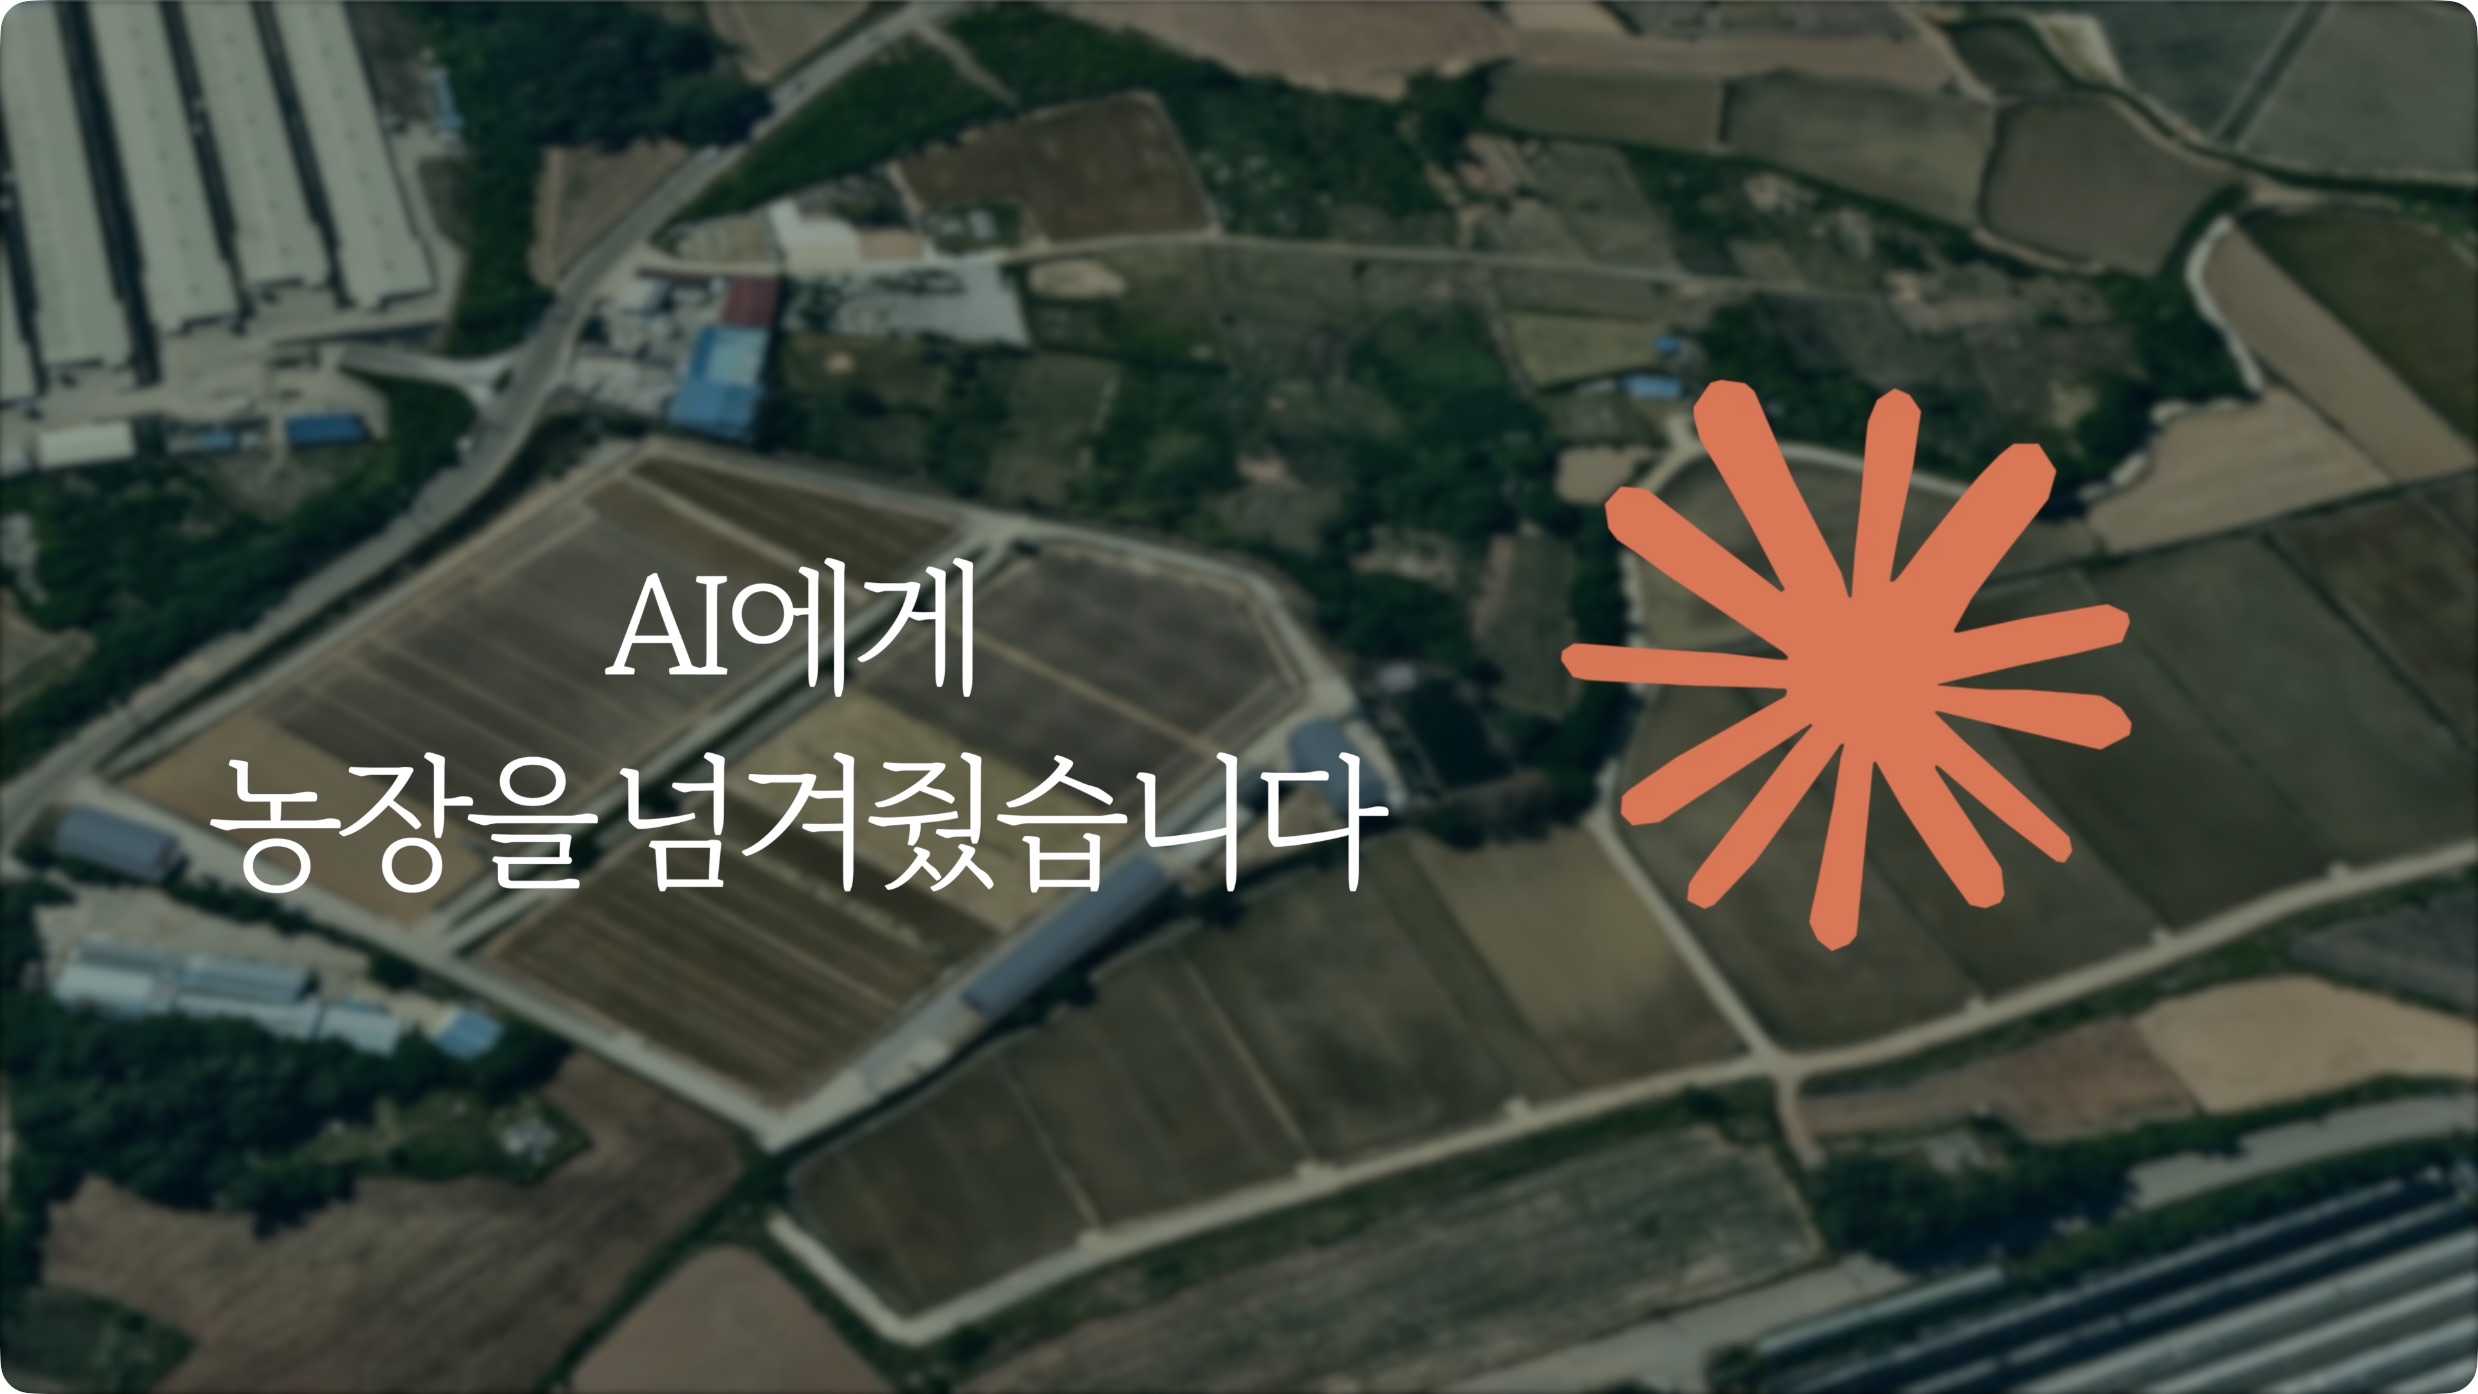
In AoT you meet what you manage as a map, not a list of text. A manager can draw or edit the land, the zones, the facilities, the equipment and the devices directly on the map as intuitive shapes.
This is not just drawing pictures. Each shape sits in a hierarchy that aggregates and processes data accordingly — automatically totalling the data from the devices inside a given zone, for instance. That hierarchical structure is what lets a manager classify even a complicated site to suit their own needs and run it systematically.
2. Records that give a space its context
Real management is complete only when it captures the living changes on site, not just the numbers. AoT lets you add a note to each parcel of land, each device, or any position you choose.
By storing what the site looked like hour by hour, as photographs or as text, you add context to the bare figures a sensor reads. Leave a photograph of a plant's condition at a particular point, or a note about something unusual in the equipment, and anyone looking later understands immediately what happened in that space.
3. Equal access to information, and better collaboration
In a digital twin environment where space, information and control are one, the pain of handover disappears. Opening the map is enough to see the whole history and the current state.
Bringing information out from between documents and drawings and onto the map means the whole management team shares the same visual picture and decides on equal footing. Resources go where they should, and anyone can reach expert-level efficiency regardless of how experienced they are. That is the future of management AoT is drawing.